Visualization and Charting 00:08
Visualization: The art of turning raw data into pretty pictures.
With this, extract insight from data.
In the context of data science and JupyterLab, this usually comes down to charting, but there is much more.
For now, we focus on the charting.
The Jupyter Notebook Visualization Landscape 00:37
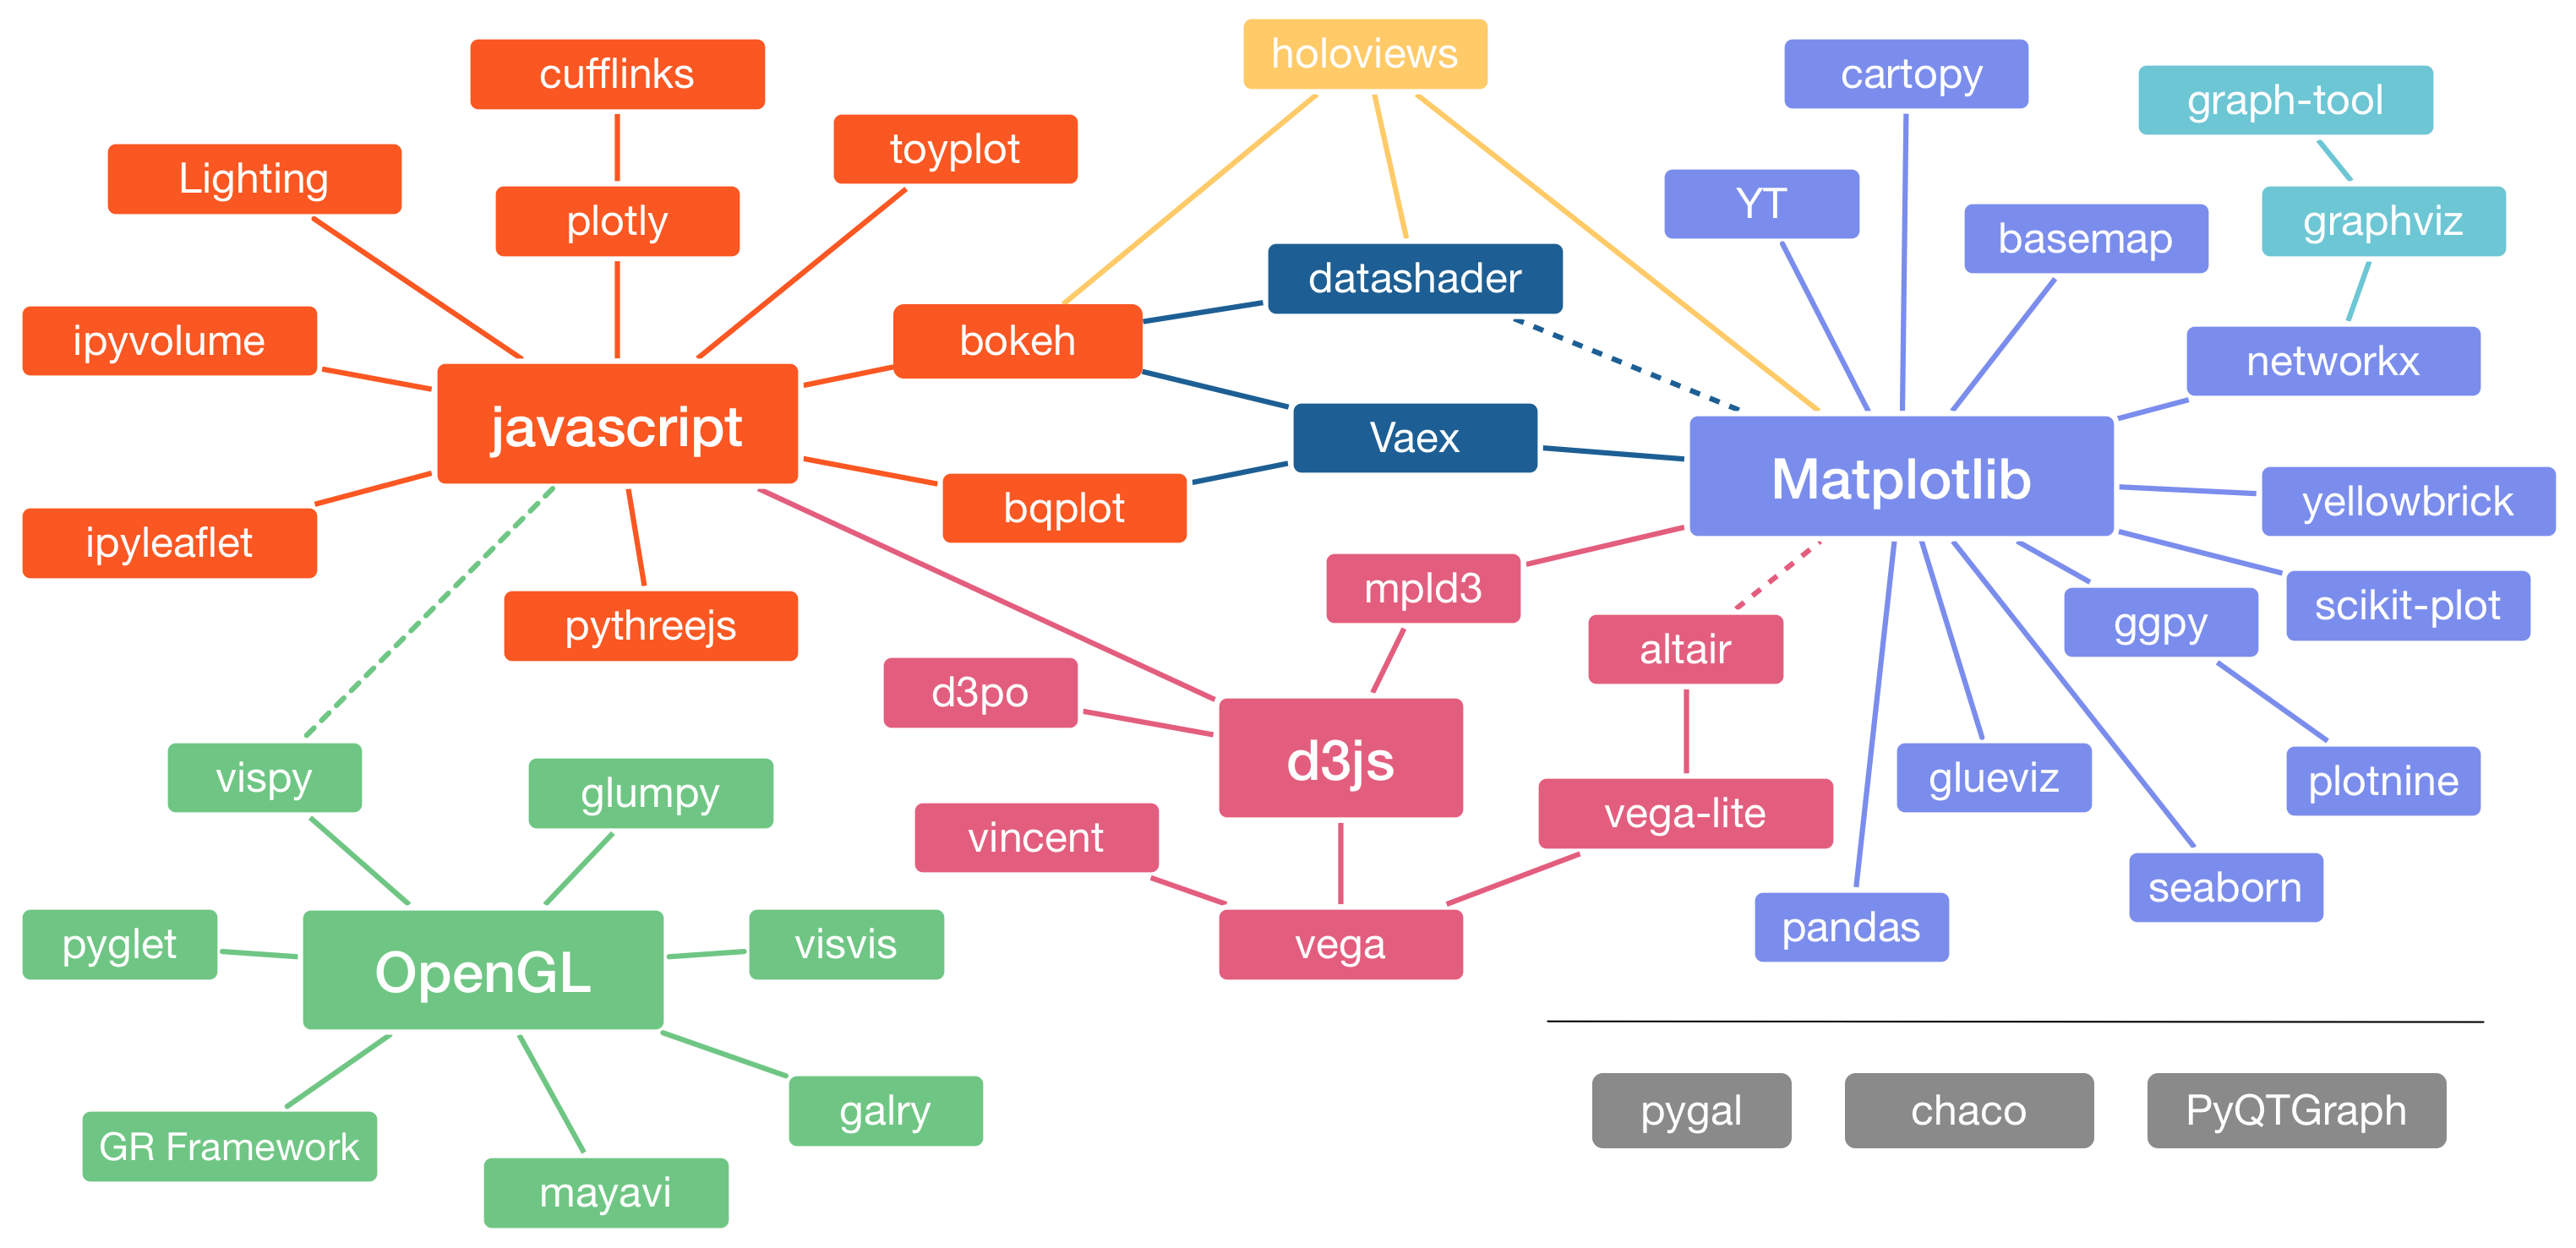
Figure above from PyCon 2017 Talk The Python Visualization landscape by Jake van der Plas. Clickable version by Nicolas P. Rougier.
Core question 01:02
Great number of plotting / charting toolkits for Jupyter.
Where should we invest our time?
For “normal” data-science and presentation purposes, there are currently two good choices, and neither of them is matplotlib. 🙂
First, what are our requirements?
Requirements 01:34
- Ergonomic API. How quickly can I build the chart I need?
- Good integration with numpy and/or Pandas.
- Interaction in JupyterLab
- ipywidgets
- linked brushing
- Presentation and documentation quality.
Why not matplotlib? 03:02
- Oldest and most entrenched; battle-tested, but:
- Modelled after matlab, and designed before the web took over.
- With some effort works in JupyterLab (still rough around the edges); this has always seemed bolted on.
- API not the most ergonomic.
In late 2018, the winners are… 04:00
Bokeh 04:25
- Built by continuum.io, the people behind Anaconda.
- Modern, easy API.
- First class support for interaction in JupyterLab.
- Easily export PNGs or SVG.
- Python code generates json-based description which is sent to Bokeh.JS on the frontend.
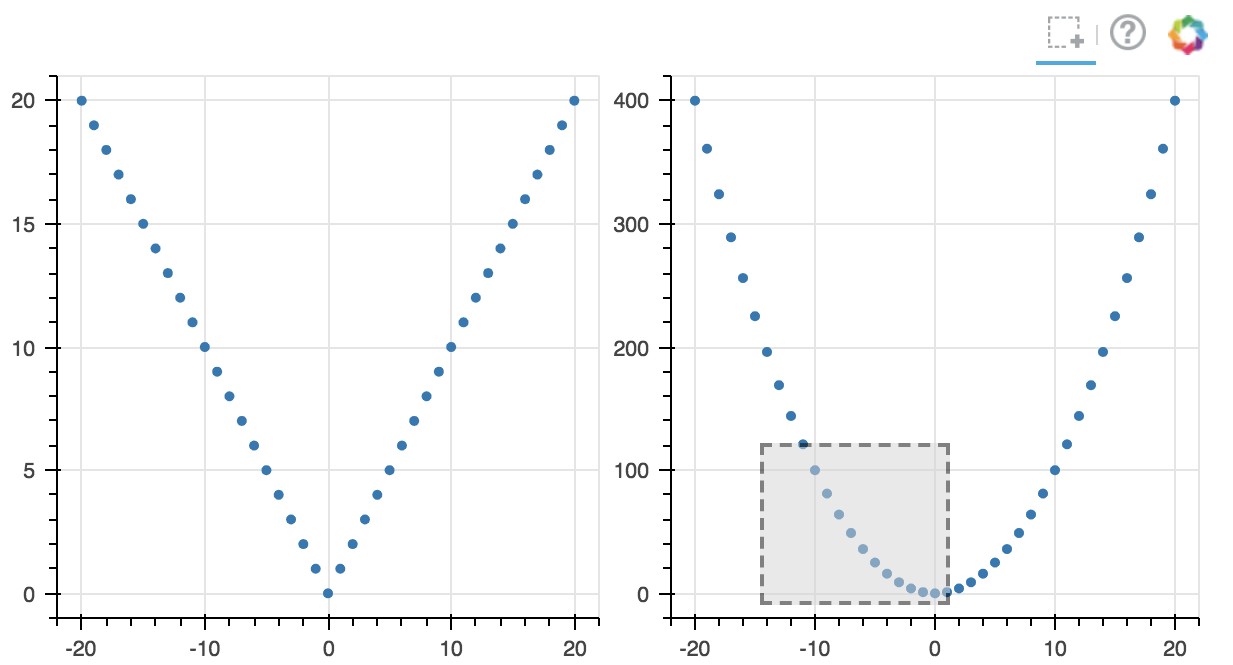
API Example 05:24
Two side-by-side plots with linked selection!
from bokeh.plotting import figure
from bokeh.layouts import gridplot
from bokeh.models import ColumnDataSource
from bokeh.io import output_notebook
output_notebook()

x = list(range(-20, 21))
y0, y1 = [abs(xx) for xx in x], [xx**2 for xx in x]

# create a column data source for the plots to share
source = ColumnDataSource(data=dict(x=x, y0=y0, y1=y1))

TOOLS = "box_select,lasso_select,help"

# create a new plot and add a renderer
left = figure(tools=TOOLS, width=300, height=300)
left.circle('x', 'y0', source=source)

# create another new plot and add a renderer
right = figure(tools=TOOLS, width=300, height=300)
right.circle('x', 'y1', source=source)

p = gridplot([[left, right]])

show(p)
Example output
This is just a screenshot. Video shows interaction starting at 05:37.
More 06:24
- vxuni bokeh lectures: Coming Soon!(tm)
- bokeh example notebooks
- bokeh reference guide
Altair 06:43
- Python frontend to the amazing vega and vega-lite visualization grammars.
- Vega: a specification whereby visualizations can be declaratively described using JSON.
- Altair is an almost straight mapping of Vega onto Python.
- Elegant API, good interaction.
- Great pandas integration:
alt.Chart(dataframe).mark_point().encode(... - API is determined by Vega: double-edged sword.
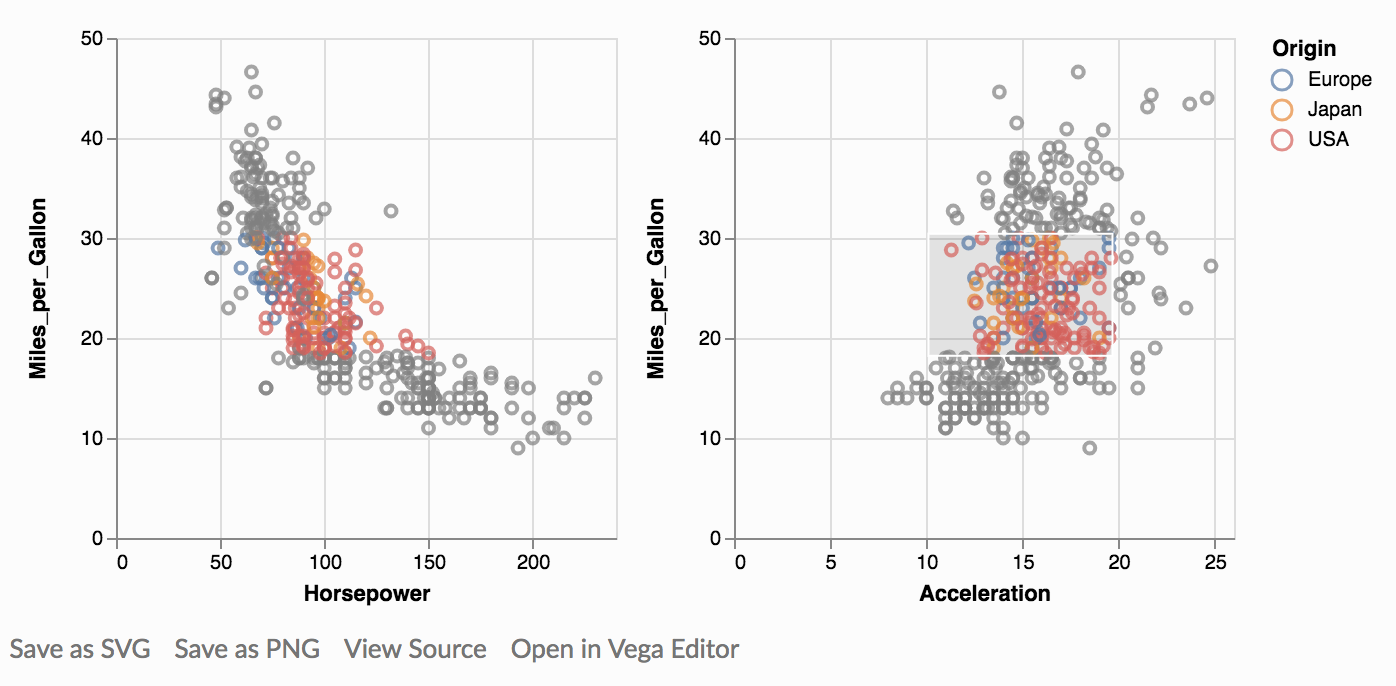
API Example 09:01
import altair as alt
from vega_datasets import data

cars = data.cars()

brush = alt.selection(type='interval', resolve='global')

base = alt.Chart(cars).mark_point().encode(
    y='Miles_per_Gallon',
    color=alt.condition(brush, 'Origin', alt.ColorValue('gray'))
).add_selection(
    brush
).properties(
    width=250,
    height=250
)

base.encode(x='Horsepower') | base.encode(x='Acceleration')
Example output
This is just a screenshot. Video shows interaction at 09:12.
More 11:30
- vxuni Altair lectures: Coming Soon!(tm)
- Altair documentation
- Example gallery
Which of the two? 11:47
Both.
Altair’s Vega-pedigree is a strong selling point, but its Vega-pedigree and its focus on statistical graphics can impact flexibility.
When Altair / Vega(-lite) has the specific chart you need, use it.
When you require more flexibility, get out your Bokeh!